
The .ng namespace has grown every year since 2020, and that growth reflects sustained work by the Nigeria Internet Registration Association (NiRA), the registry that operates it. NiRA has built the accredited registrar network to 168, published a 2026 business plan committing to marketing, DNSSEC deployment, governance reform and policy engagement, and secured NITDA’s formal endorsement of it. Since July 2026 it has issued a monthly Domain Performance Report to accredited registrars — a level of operational transparency many country-code registries do not offer, and the reason a reference like this one can be compiled at all. The analysis that follows engages with the figures NiRA publishes; it does not substitute for them.
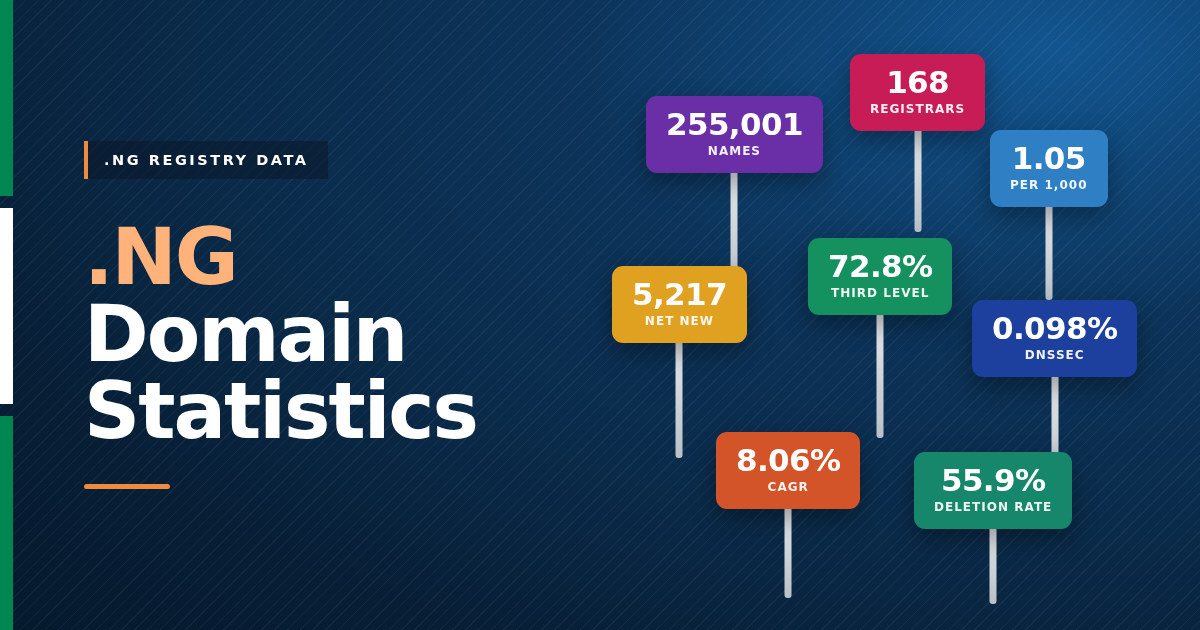
NG domain statistics for 2026 put the namespace at 255,001 names under management, held across 168 accredited registrars, growing at roughly 5,200 genuinely new names a month. This page is a standing reference, updated as each monthly report is issued.
Every figure is traced to a named source and marked primary or secondary. Every derived figure states its formula. The underlying tables are published as CSV so the numbers can be checked rather than taken on trust. Where the data does not support a conclusion, this page says so rather than filling the gap.
Key findings
- 2.34× — the factor by which the published “net growth” figure exceeds the count of genuinely new names, because the column adds renewals to registrations.
- 1.05 per 1,000 people — .ng domains per head of population, against 21.41 for .za and 1.96 for .ke. Nigeria trails Kenya per capita despite four times the population.
- 8.06% a year — compound annual growth from May 2020 to August 2026. The 2026 target of +30% implies a rate 3.7 times that trend.
- 55.9% — deletions as a share of new registrations in August, up from 51.1% in July.
- 72.8% — third-level share of August registrations, up from 57.8% in July. Second-level registrations fell 32.9% in the same month.
- 0.098% — share of the .ng zone signed with DNSSEC: 251 names of 255,001.
Where .ng domain statistics come from
Published .ng domain statistics come from sources of uneven quality, and mixing them produces the contradiction set out further down. Two of the readings below are stocks that can be compared with one another; one is a monthly flow that cannot, and is excluded from every calculation here.
| When | Reading | Source | Confidence |
|---|---|---|---|
| 1995 | .ng delegated; adoption stays marginal against .com for two decades | Guardian Nigeria, historical coverage | Secondary |
| Aug 2017 | 4,274 registrations in the month, plus 2,103 renewals — a flow, not a stock | Registry media update (dating internally inconsistent) | Secondary |
| May 2020 | 157,072 names registered — the base for long-run growth rates here | Registry reporting via press coverage | Secondary |
| 2025 | 241,000 active names; 98,285 new, 71,470 renewals, 1,970 restorations. No as-at date published | The Point NG / NITDA coverage | Secondary |
| May 2026 | Registry targets +30% for the year across four programme tracks | Technology Times, 3 May 2026 | Secondary |
| Jul 2026 | Monthly registrar reporting begins — where the series below starts | NiRA Registrar Domain Performance Report, July 2026 | Primary |
| Aug 2026 | 255,001 under management; 168 accredited registrars | NiRA Registrar Domain Performance Report, August 2026 | Primary |
The size of the .ng domain namespace
Measured as a stock, .ng domain registrations rose from 157,072 in May 2020 to 255,001 in August 2026 — a gain of 62.3% over six years and three months. That is a compound annual growth rate of 8.06%: steady, unspectacular, and consistent with a namespace expanding through registrar distribution rather than a demand shock.
The 2026 business plan targets +30% on the 2025 base, which would mean 313,300 names by December. Reaching that from 255,001 needs 14,575 net new names a month for four months. August produced 5,217, about 36% of that pace. Holding August’s rate to year end lands near 275,900, a gain of roughly 14.5%.
Why .ng domain statistics disagree between annual and monthly reporting
The annual stock readings and the monthly activity figures do not reconcile with one another.
| Measure | Value | Implied monthly |
|---|---|---|
| Gain from the 2025 base to August 2026 | +14,001 | 1,750 |
| Net new names reported in August alone | +5,217 | 5,217 |
| Eight months at August’s rate would give | +41,736 | gap of 27,735 |
Either the 241,000 baseline is dated earlier than “2025”, or the monthly net figures run ahead of what reaches the zone. Until an as-at date is published for 241,000, year-on-year percentages built on it — including the +30% target — carry that uncertainty with them.
The .ng domain statistics monthly series
The registry publishes each month’s activity but does not publish a continuous series. This section maintains one. The series begins with July 2026, the first monthly report issued, and a row is added each time a new report arrives, so the record lengthens rather than being replaced. Two months establish a baseline, not a trend: month-on-month movements below are observations, and should not be read as direction until at least six months exist.
| Month | Regs | Renewals | Restor. | Transfers | Deletions | Reported | Net new | Del. rate | 3rd lvl |
|---|---|---|---|---|---|---|---|---|---|
| Jul 2026 | 11,044 | 6,766 | 174 | 296 | 5,646 | 12,164 | 5,572 | 51.1% | 57.8% |
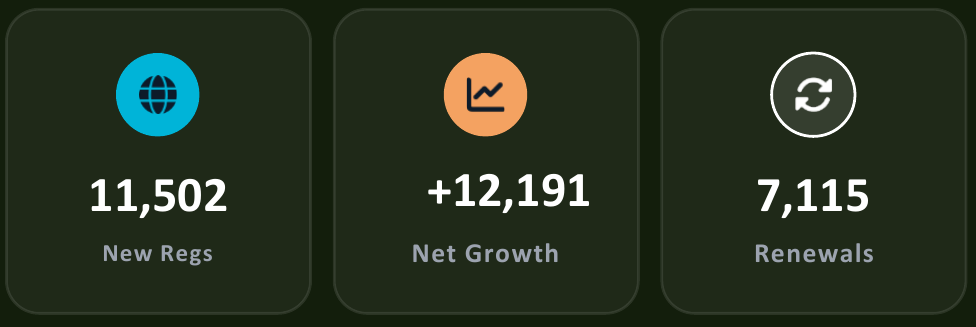
| Aug 2026 | 11,502 | 7,115 | 141 | 189 | 6,426 | 12,191 | 5,217 | 55.9% | 72.8% |
| Series mean | 11,273 | 6,941 | 158 | 243 | 6,036 | 12,178 | 5,395 | 53.5% | 65.3% |
Across the two months observed, the namespace has taken on a mean of 5,395 net new names a month while the reported figure averaged 12,178. Deletions averaged 53.5% of new registrations. The next row is due when the September report is issued, expected mid-October 2026.
How .ng domain growth statistics are calculated
The August report states a specific, checkable figure and prints the table that produces it. Read together, they show the “net growth” column is built from registrations plus renewals less deletions.
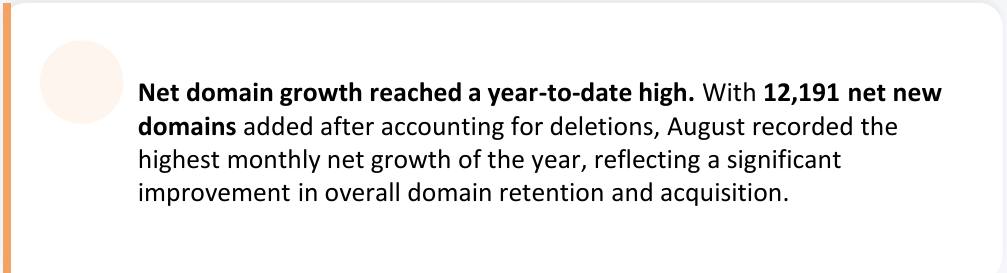
What the column computes: registrations 11,502 + renewals 7,115 − deletions 6,426 = 12,191. This reconciles exactly in all six rows of the table, across both months.
Names not previously in the zone: registrations 11,502 + restorations 141 − deletions 6,426 = 5,217.
A renewal is a name already under management. It was counted in a previous period and it is counted again in this one, so including it in growth measures continuity rather than expansion. Both figures are legitimate and they answer different questions: 12,191 describes total billable activity net of losses, while 5,217 describes how much the namespace actually grew. The distinction matters when the headline figure is carried into market sizing, year-on-year comparison or policy reporting, where the two definitions produce materially different answers.
.ng domain registration statistics by level
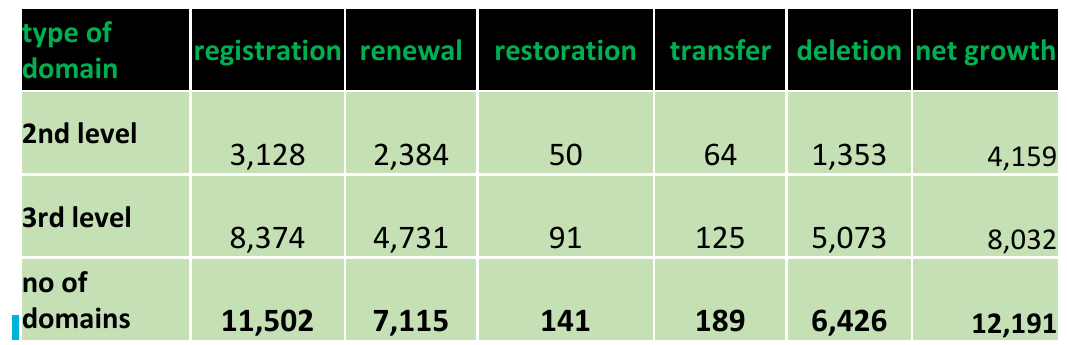
.ng domains are sold at two levels. Second-level names take the form example.ng and sell at a premium; third-level names such as example.com.ng sit under a generic prefix and cost less. In August the premium tier recorded 3,128 registrations against July’s 4,659 — a fall of nearly a third — while the third level absorbed the difference, rising 31.2%. Total registrations barely moved (+4.1%) because the two offset each other, which is how a mix shift stays hidden inside a headline total.
| Level | Registrations | Renewals | Restorations | Deletions | Reported | Net new |
|---|---|---|---|---|---|---|
| 2nd level | 3,128 | 2,384 | 50 | 1,353 | 4,159 | 1,825 |
| 3rd level | 8,374 | 4,731 | 91 | 5,073 | 8,032 | 3,392 |
| All domains | 11,502 | 7,115 | 141 | 6,426 | 12,191 | 5,217 |
On the net-new measure the premium tier added 1,825 names in August rather than 4,159. The third level deleted 5,073 against 8,374 registrations, making it the higher-churn segment and the one currently carrying growth.
.ng domain adoption in international context
Absolute domain counts flatter large countries. Normalised per head of population, the .ng namespace is the smallest of the three major African country-code domains for which comparable figures exist — and it trails Kenya despite Nigeria having more than four times the population.
| ccTLD | Country | Domains | Population | Per 1,000 | .ng at this rate |
|---|---|---|---|---|---|
| .za | South Africa | 1,400,000 | 65.4m | 21.41 | 5,180,428 |
| .ke | Kenya | 115,000 | 58.6m | 1.96 | 474,915 |
| .ng | Nigeria | 255,001 | 242.0m | 1.05 | — |
South Africa’s per-capita adoption is 20.3 times Nigeria’s. Matching Kenya’s rate would require 474,915 .ng names, roughly 1.9 times the current total; matching South Africa’s would require 5.18 million. At August’s net-new rate of 5,217 a month, closing the gap to Kenya alone would take about 42 years. This gap, not the absolute count, is the strongest available evidence that the .ng namespace is under-adopted rather than simply young.
DNSSEC statistics for .ng domains
DNSSEC signs DNS responses cryptographically so a resolver can detect tampering. The 2026 business plan commits to DNSSEC across the .ng zones, and the August report is the first to publish adoption figures. They show the capability exists but is almost entirely undeployed.
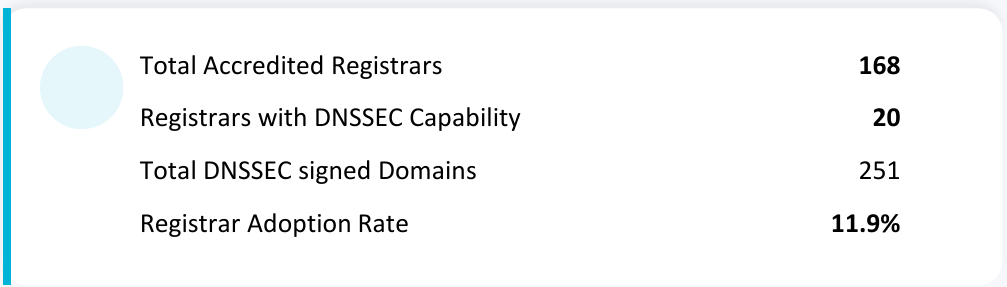
Twenty of 168 registrars can offer DNSSEC — the published adoption rate of 11.9%. But capability is not deployment: between them those twenty have signed 251 names, an average of about twelve each, against a zone of 255,001. That is 0.098% of the namespace, leaving 254,750 .ng names unsigned. Anyone who needs DNSSEC on a .ng domain should confirm support with a registrar before registering, because most cannot provide it.
What the .ng domain statistics mean for registrants
.ng domain growth runs near 5,200 names a month
Market sizing built on the reported net-growth figure will be roughly 2.34× too high. Across all 168 accredited registrars the namespace is taking on about 5,200 genuinely new names a month. The same correction applies to the +30% target: at August’s net-new rate the year ends near 275,900, about +14.5% on the 2025 base.
Volume has moved to third-level .ng domains
The third level took 72.8% of August’s registrations, up from 57.8% in July. The second level remains the shorter, more memorable option and still commands a premium — but that premium now has to be justified against a cheaper alternative most of the market is taking.
DNSSEC on .ng domains is rarely available
148 of 168 accredited registrars cannot offer DNSSEC at all. Any organisation with a security requirement for signed DNS — financial services, public sector, anything handling payment or identity data — should treat DNSSEC support as a qualifying question when choosing a .ng registrar, not something to discover after transfer.
Deletions run at over half of new .ng registrations
August recorded 6,426 deletions against 11,502 registrations — 55.9%, up from 51.1% in July. Much of that is avoidable expiry rather than deliberate abandonment. Auto-renew and a monitored expiry calendar are worth more to a .ng portfolio than any acquisition discount, because a lapsed name can be re-registered by anyone once it leaves the redemption period.
Methodology behind these .ng domain statistics
Every derived figure is computed from tables printed in the registry’s monthly reports. No figure is estimated, modelled or smoothed.
- Registration — a name newly added to the zone. Always an increase.
- Renewal — an existing name whose term is extended. Not an increase: the name was already counted.
- Restoration — a name recovered from redemption after expiry. An increase.
- Transfer — a name moving between registrars. Neutral to the zone total.
- Deletion — a name leaving the zone. A decrease.
- Reported net growth — the registry’s published column:
registrations + renewals − deletions. - Net new names — used throughout this page:
registrations + restorations − deletions. Transfers excluded as zone-neutral. - Deletion rate —
deletions ÷ registrations × 100. A churn indicator, not a retention rate. - Per 1,000 population —
names ÷ population × 1,000, using 2026 population estimates from the cited source. - CAGR —
(end ÷ start) ^ (1 ÷ years) − 1, over 6.25 years from May 2020 to August 2026. - Stock vs flow — a stock is a count at a point in time; a flow is activity during a period. The two are never added together here.
Limitations of these .ng domain statistics
Stated plainly, because a figure quoted without its limitations is a figure waiting to be misused.
- The 241,000 baseline has no published as-at date. Every year-on-year percentage built on it, including the +30% target, inherits that ambiguity.
- The monthly series begins in July 2026. Two months of first-party data is not a trend.
- The monthly report is distributed to accredited registrars rather than published. Readers cannot independently retrieve it, and must rely on the figures and exhibits reproduced here.
- Pre-2026 readings are press-sourced rather than taken from registry documents.
- Comparator ccTLD figures are approximate — rounded press figures from a single 2026 article, not those registries’ own reporting. The per-capita ratios indicate scale, not precision.
- Deletion rate is not retention. Deletions in a month are not the same names as registrations in that month, so the ratio describes churn pressure, not cohort survival.
- No pricing, registrant or geographic breakdown exists. Nothing here should be read as evidence about registrant behaviour beyond the counts themselves.
- The 2017 figure is a flow and is excluded from every calculation.
Download the .ng domain statistics data
Every figure above is published as machine-readable CSV so it can be checked, recomputed or extended.
- ng-domain-monthly-activity.csv — the monthly series with both growth definitions and derived rates. Grows with the table above.
- ng-domain-stock-readings.csv — point-in-time counts of names under management, each with source and confidence marking.
- cctld-adoption-comparison.csv — .ng, .za and .ke counts, populations and per-1,000 adoption rates.
How to cite these .ng domain statistics
Cite the version, because the figures are revised as each monthly report is issued.
NG Domain Statistics (v1.0, 22 September 2026). Derived from NiRA Registrar Domain Performance Reports, July and August 2026. Retrieved from https://www.tkwebhosts.com/ng/tutorials/ng-domain-statistics/
The analysis, derived figures and CSV files may be quoted and redistributed with attribution to this page and its version number. The underlying monthly reports remain the property of the .ng registry and are not redistributed here in full; the exhibits are reproduced as evidence for the specific figures they support.
Sources for these .ng domain statistics
- Registry — Nigeria Internet Registration Association (NiRA), operator of the .ng namespace and publisher of the monthly Domain Performance Reports cited here.
- Primary source — NiRA Registrar Domain Performance Report, August 2026, issued 15 September 2026 to accredited registrars. Source of all August figures and the four exhibits.
- Comparison source — NiRA Registrar Domain Performance Report, July 2026, issued 10 August 2026.
- Historical readings — Guardian Nigeria, The Point NG, BusinessDay, ThisDay, Quartz and Technology Times, 2017–2026. All pre-2026 figures are press-sourced.
- Comparator ccTLDs — .za and .ke counts and all three population figures: Technology Times, 3 May 2026.
Version 1.0, published 22 September 2026. Figures current to August 2026. Series begins July 2026 and is extended as each monthly report is issued.